
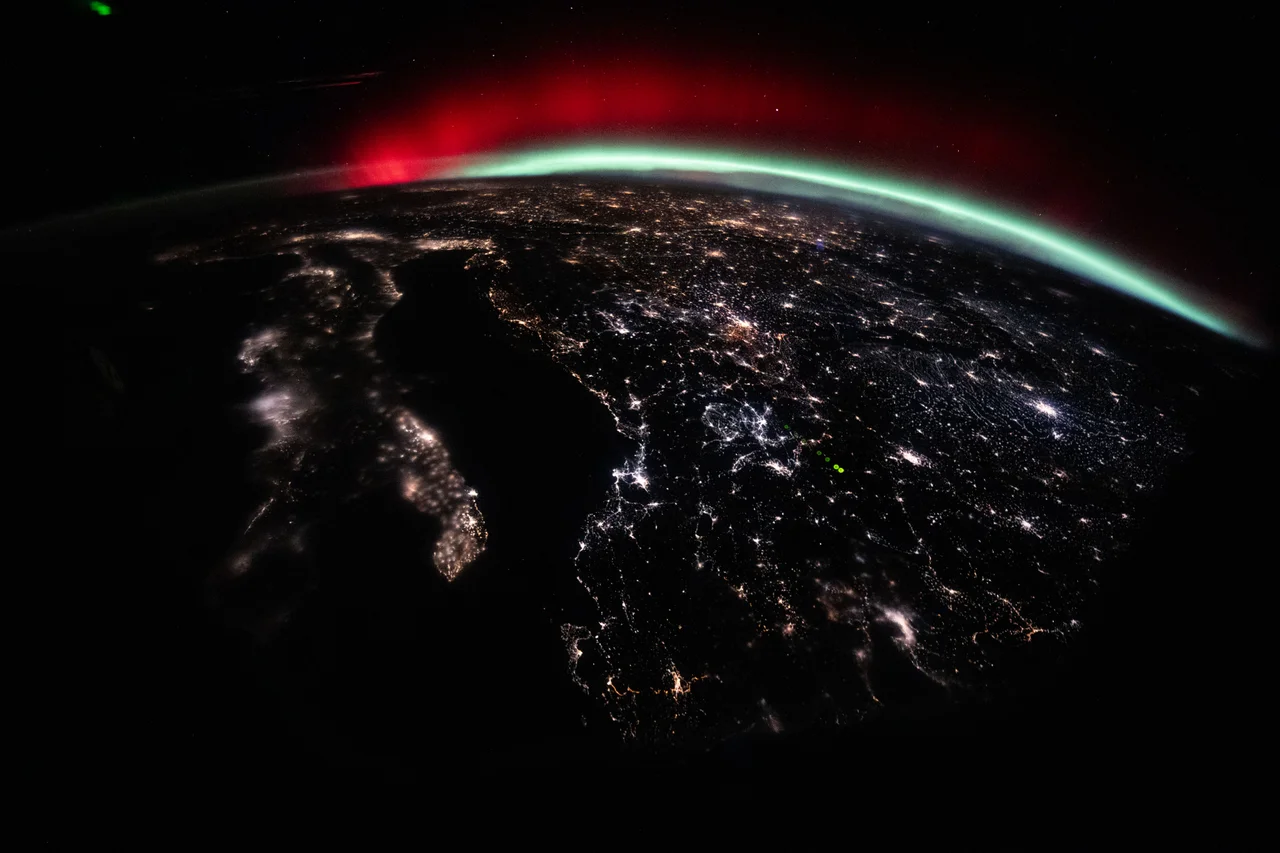
A green curtain can acquire a red roof and a pink fringe within the same auroral display. The colors are real light from Earth’s atmosphere, but they are not a simple temperature scale. They tell a story about atoms, molecules, the energy reaching them, and whether they have time to shine before another collision interrupts.
To read that story, start with a distinction: the Sun helps supply the energy, while gases around Earth supply the visible glow. A photograph captures the result of both, filtered through a camera and our own expectations.
How energy reaches the auroral oval#
The Sun and the glowing atmosphere are separated by more than empty distance. Earth's magnetosphere, the region shaped by its magnetic field, stores and redirects energy from its interaction with the solar wind. NOAA emphasizes that the electrons producing familiar auroras are accelerated within this magnetic environment; it is misleading to draw all of them as a direct, uninterrupted stream from the Sun to the glowing curtain.
Electrons moving along magnetic field lines can reach the upper atmosphere near the magnetic poles. The connections form broad auroral ovals, rather than illuminating only one point at each pole. During stronger geomagnetic activity, the bright region can extend to lower latitudes. The glow is the atmospheric end of a much larger process.
Sources: [2]
The atmosphere makes the light#
Imagine giving an atom a brief energy loan. A collision can push one of its electrons into a higher energy state. When the atom releases that extra energy, it can emit a photon: a small packet of light. Molecules have their own sets of possible energy changes. The emitted colors depend on which of those changes occurs.
In an aurora, energetic particles excite oxygen and nitrogen high above the ground. This is why the familiar comparison with a neon lamp is useful: a gas can glow when energy is delivered to it. But an aurora has no glass tube, and its energy arrives through a vast natural electrical environment. The luminous curtain is atmosphere responding to that energy, rather than a colored substance poured into the sky.
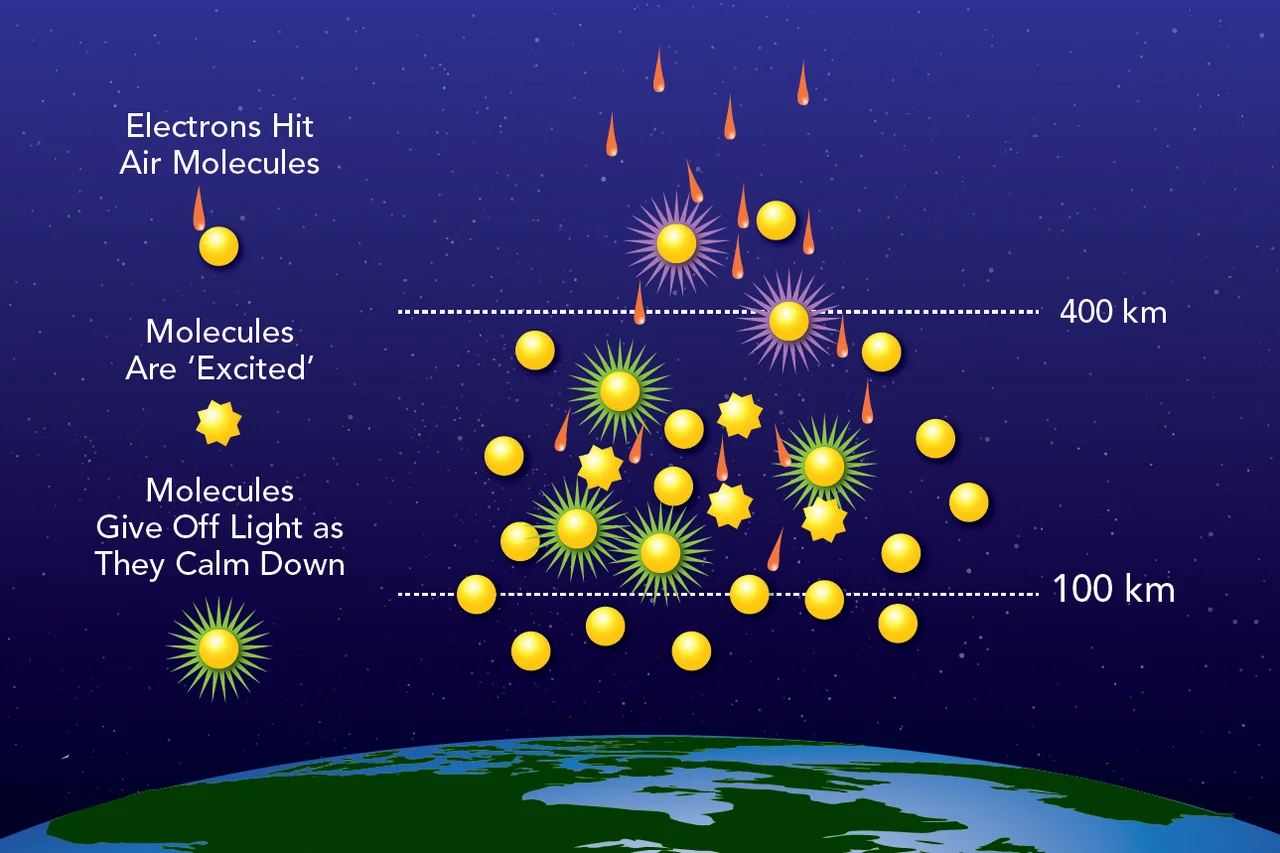
Image unavailable.
NASA schematic showing incoming electrons transferring energy to atmospheric particles, which then release light. Dashed guides mark 100 and 400 kilometers.
What a green photon tells us#
An atom can occupy specific energy states. An emission line appears when a transition between states releases a photon with the corresponding energy. That is why a particular oxygen transition can repeatedly produce green light near 557.7 nanometers, rather than any color chosen at random.
The relationship is E = hc / wavelength: photon energy equals Planck's constant times the speed of light, divided by wavelength. For 557.7 nanometers, the result is about 3.56 × 10⁻¹⁹ joule, or 2.22 electronvolts, per photon. An electronvolt is a convenient unit for energies on the scale of atoms. The energy-level drawing uses a simplified pair of states; it is not a complete oxygen spectrum or a picture of electrons orbiting a nucleus.
This calculation tells us the energy carried by one green photon. It does not measure the total power of an aurora, the temperature of all the surrounding gas, or the energy of every incoming electron. Brightness also depends on how many emitting particles contribute light along the line of sight.
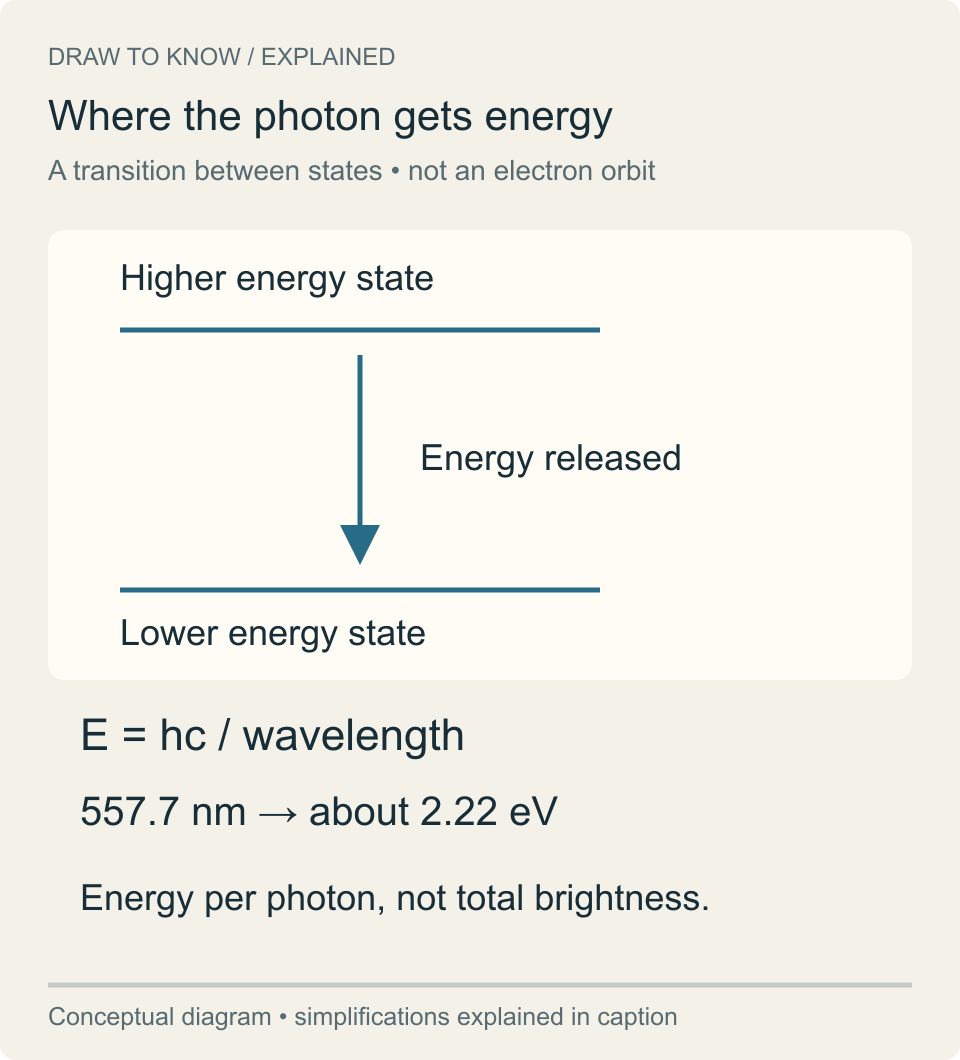
Image unavailable.
A downward transition between two energy levels releases a photon; the green 557.7 nanometer example corresponds to about 2.22 electron volts.
One element, two very different colors#
Atomic oxygen produces the familiar green emission at about 557.7 nanometers. Oxygen can also emit red light after a different transition. The important difference is timing: the state responsible for red oxygen light can persist much longer before releasing a photon than the state associated with green.
Where the air is denser, an excited oxygen atom is more likely to collide with another particle before it emits that red photon. The collision can remove the energy without producing the expected light, a process called quenching. Higher up, where collisions are less frequent, the red emission has a better opportunity to appear. This is why a display often puts a diffuse red glow above the brighter green curtains. The same chemical element can therefore mark different conditions at different heights.
NOAA's tutorial gives a lifetime of about one second for the oxygen state associated with green emission, compared with more than 150 seconds for the slow red-emitting state. These are characteristic lifetimes, not clocks that make every atom emit on schedule. Collisions add another possible way for the excited state to end. The race between those possibilities helps explain why atmospheric density changes the visible mixture.
The diagram separates the two outcomes. One path releases a photon. The other transfers energy in a collision before the expected emission occurs. It shows the mechanism, not measured probabilities for a particular auroral event.
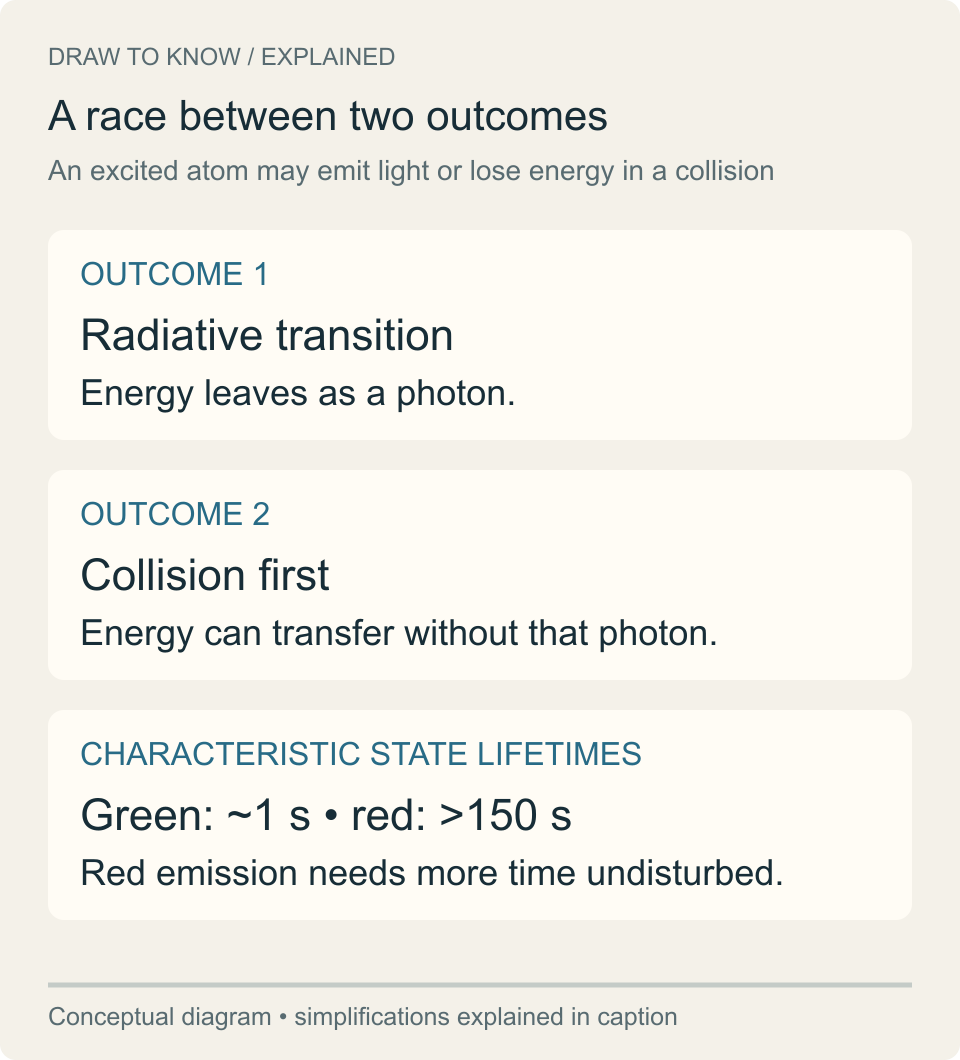
Image unavailable.
Cards compare photon emission with collision quenching, then give approximate characteristic lifetimes of the relevant green and red oxygen states.
Sources: [2]
Nitrogen adds the blue and pink#
Nitrogen contributes blue, violet and reddish emissions. Their combination with oxygen light helps produce the purple and pink that can edge an auroral curtain. Some nitrogen emissions occur quickly after excitation, which lets them survive at lower, denser heights where slow oxygen emissions can be interrupted.
NASA’s introductory guide places much green and blue auroral light around 100–200 kilometers above Earth, red oxygen higher than about 200 kilometers, and pink nitrogen near or below roughly 100 kilometers. Treat those values as a first sketch. They are useful for understanding the arrangement of a curtain, but the sky does not have sharp colored floors. The incoming particles have different energies, gas densities vary, and several emissions may overlap along the same line of sight.
Sources: [1]
Why a color chart is not an altitude meter#
An orbital photograph makes the vertical structure easier to appreciate. NASA’s account of an August 2024 view from the International Space Station describes green oxygen emissions around 100–250 kilometers, with red oxygen extending as high as 500 kilometers. That is a broader picture than a simple two-layer classroom diagram.
Published introductory ranges also differ. NASA's broad color guide puts red oxygen above about 200 kilometers, while NOAA emphasizes its slow red-emitting state above about 300 kilometers. These summaries are guides to changing conditions, not competing definitions of a hard boundary. An observed display must be interpreted with its own viewing geometry and measurements.
The practical lesson is to resist reading an exact altitude from a single color in a photograph. A red area is evidence consistent with high-altitude oxygen emission; it is not a height measurement on its own. A ground observer also looks through an extended volume of atmosphere, often at a shallow angle. The apparent edge of one color can be where emissions overlap in the view rather than a physical boundary between two gases.
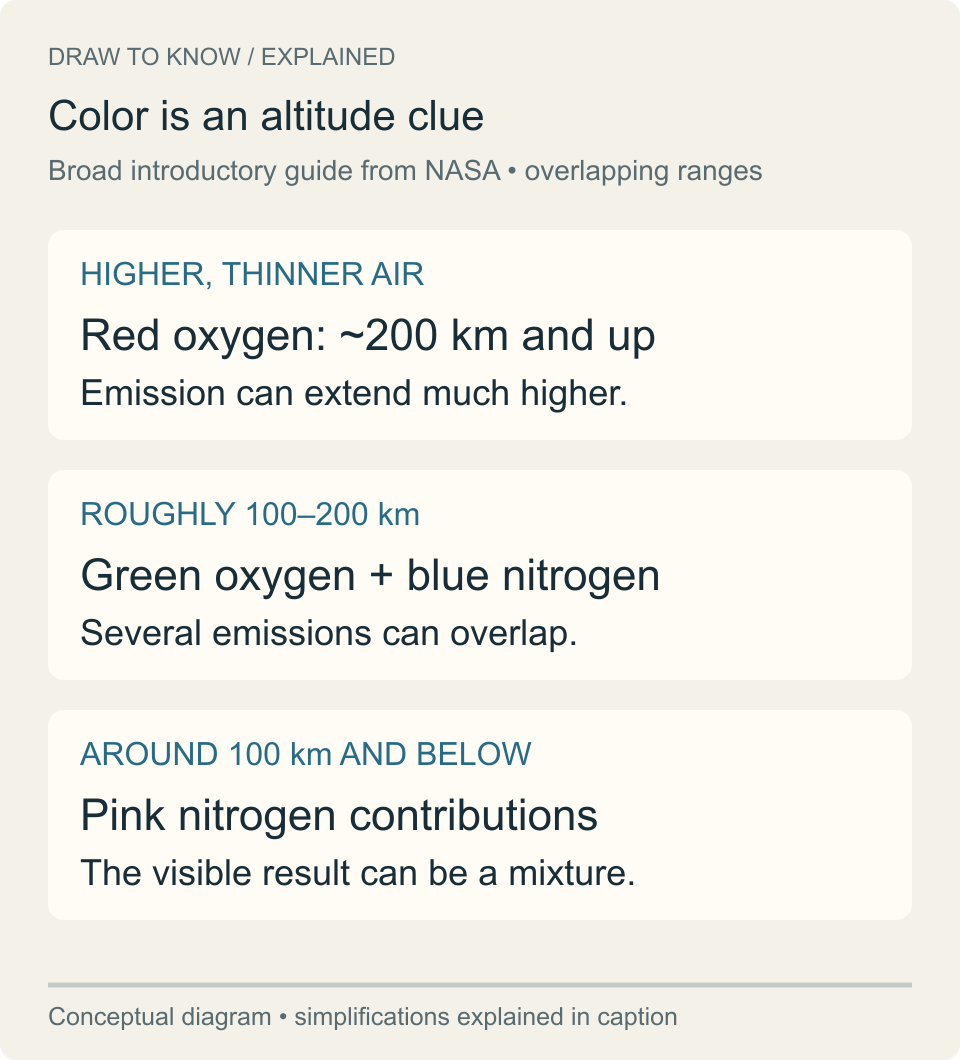
Image unavailable.
Three broad altitude bands associate red oxygen with higher air, green oxygen and blue nitrogen with middle auroral heights, and pink nitrogen contributions with lower heights.
Why a camera can see more color than you do#
An aurora that looks faint or nearly colorless to your eyes can show distinct green or red in a photograph. In darkness, our ability to distinguish color is limited. Cameras can collect a useful signal from light too faint for us to perceive in the same way. That does not mean the camera invented every color.
It also does not mean every photograph reproduces the experience of standing beneath the sky. Exposure, white balance and later image processing influence the appearance. Two people can observe the same faint display while two cameras render it differently. When comparing images, ask about those settings and the viewing conditions before concluding that the atmosphere changed. A photograph and a naked-eye description are different kinds of observation, each with its own limits.
Read the instrument as well as the sky#
Color can be absent from a scientifically useful image. In October 2024, a satellite’s day-night sensor recorded aurora over North America as pale ribbons in a grayscale image. The instrument measured nighttime light across a band of wavelengths; the published view was not a photograph of how a human observer would see the colors.
This matters when an auroral image travels without its caption. A grayscale detection, a visible-light photograph and an explanatory drawing answer different questions. Check the instrument, date and caption first. Then use the colors as clues: oxygen commonly supplies green and high red, nitrogen contributes blue and pink, and the displayed result depends on emissions, geometry and observation. The explanation becomes more interesting once those distinctions are kept intact.
Sources: [5]
Keep exploring
Sources & further reading
Follow the original research, records, and explanations behind this story.
- Auroras NASA Science
Gas identities, broad altitude guide, and the credited explanatory diagram.
- Aurora Tutorial NOAA Space Weather Prediction Center
Magnetospheric electrons, emission states, collision quenching, and the limits of color vision.
- What Is an Aurora? NASA Space Place
Introductory explanation of particle collisions and atmospheric light.
- Aurora Australis and the International Space Station NASA Astronomy Picture of the Day
A documented orbital view and the extended vertical range of oxygen emissions.
- A Colorful Aurora Paints the Night Sky NASA Earth Observatory
A grayscale satellite observation compared with visible auroral colors.
- Red, Green Light Show NASA
Hero photograph, date, location and NASA/Chris Williams credit.
- NASA’s Guide to Finding and Photographing Auroras NASA Science
Camera sensitivity, exposure and white-balance settings; observing geometry.
- Spectroscopy 101 — Light and Matter NASA Science
Photon energy, wavelength and transitions between energy states. Numerical photon-energy example is calculated in this article.
See the story in motion
Watch our illustrated video, then explore another question below.
Watch on YouTubeFollow the thread