
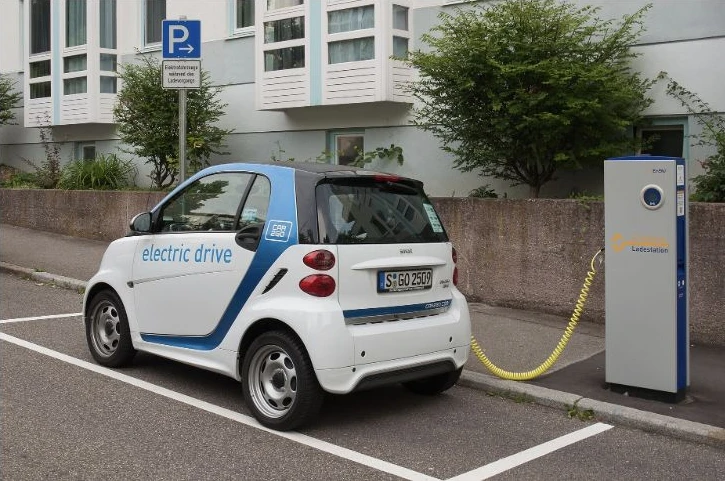

The International Energy Agency (IEA) finds that, on a global average, a medium-size battery electric car has about half the lifetime greenhouse-gas emissions of an equivalent combustion-engine car. The comparison includes the footprint beyond the exhaust pipe, and its result depends on the cars, electricity supply and lifetime distance assumed.
Steel and aluminium must be made, battery materials extracted and processed, and electricity generated. A fair climate comparison follows both an electric car and a petrol car through those stages and the miles they travel. It also keeps greenhouse-gas accounting separate from questions about local pollution, water and material use.
What does a fair comparison count?#
A lifecycle assessment draws a boundary around a product and adds emissions from the activities inside it. For a car, that can mean mining and processing raw materials, making components and assembling the vehicle, supplying energy for driving, and dealing with the car at the end of its life. Greenhouse gases are often expressed as carbon dioxide equivalent: different gases are converted into a common climate-impact unit. The number depends on what the study counts and how it models those activities.
The two energy paths need comparable treatment. For a petrol car, a tailpipe measurement captures carbon dioxide released when fuel burns, but it does not count all the emissions from extracting crude oil, refining it into fuel and transporting that fuel. For a battery electric car, there is no exhaust pipe; its driving-related emissions arise largely in the production of the electricity used to charge it. Making either vehicle also requires energy and materials.
A narrower study can still answer a useful question. A well-to-wheel comparison follows energy from its source to the moving vehicle, but does not automatically include making the vehicle and its battery. Calling a well-to-wheel result a complete lifecycle result would leave out a consequential part of the electric car's starting footprint. Conversely, comparing only battery manufacture with the whole life of a petrol car would omit years of driving.
The comparison also needs a common service: cars of similar size travelling a specified distance. An unusually large electric SUV and a small petrol car are not interchangeable examples of their technologies. The IEA's lifecycle calculator makes size, fuel economy, lifetime and energy supply adjustable precisely because they matter to the result.
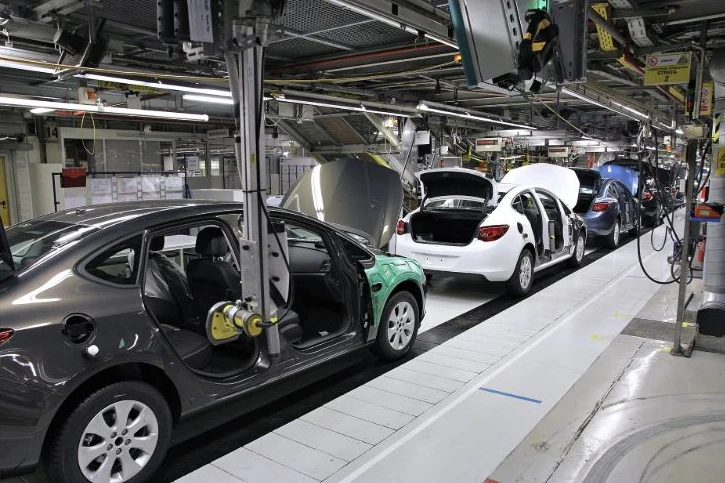
Image unavailable.
Cars at different stages of assembly on a production line inside a factory.

Why does the battery change the starting line?#
Before either car travels its first mile, production has already caused emissions. Both need a body, wheels, electronics and manufacturing facilities. A battery electric car additionally needs a large traction battery. Its materials must be extracted, refined and assembled into cells and packs. Those operations use energy, and their emissions depend in part on the fuels and electricity used along the supply chain.
That is why making a typical electric car can produce more greenhouse gases than making a comparable petrol car. It is a real starting disadvantage in the climate ledger, not an emission that disappears because the finished vehicle is quiet. Battery size and chemistry, the energy used in processing and factories, and the rest of the vehicle all matter. A larger pack can store more energy but also requires more materials; it cannot be assigned the same manufacturing footprint as a smaller pack without checking the assumptions.
The IEA's December 2024 battery-supply-chain report calls battery-related emissions a notable part of an EV's lifecycle, though not its largest contributor in the assessment. It identifies cleaner production processes, higher energy density and recycled materials as routes to reduce those emissions. Those are opportunities, not proof that every battery has already achieved them.
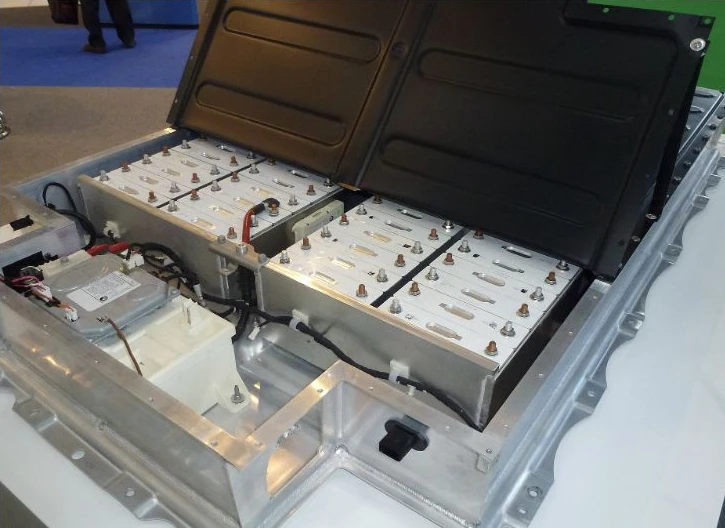
Image unavailable.
An open battery pack displays several modules in a metal enclosure.

What does the electricity behind a charge mean?#
An electric motor receives energy from a battery; the battery must be charged from an electricity system. If a generator burns coal or gas, that electricity carries emissions. Wind, solar, hydro and nuclear generation do not burn fossil fuel at the point of generation, although their infrastructure and fuel supply chains have lifecycle impacts of their own. A power system combines sources, and the mix can change across places, hours and years.
For scale, Ember's Global Electricity Review 2026 reports that renewables produced 33.8% of global electricity in 2025. Coal alone supplied 33.0%. These are shares of electricity actually generated across the world during that year, not shares of all energy use, nor the installed capacity of power plants. They do not tell a driver exactly which generators responded to one charging session.
A national annual average is a useful starting point for some comparisons, but it can hide regional and hourly differences. Charging adds demand to a shared grid. The emissions associated with extra demand can depend on which plants change output, what transmission constraints exist and when the car charges. A lifecycle study may instead use an average grid intensity over its assumed life. These are different accounting questions; neither turns a global annual share into a measurement at one socket.
A car can also be charged for many years as its grid changes. Assuming today's generation mix remains fixed gives one estimate; assuming a cleaner future grid gives another. The second is a scenario, not a guaranteed forecast. Wind and solar vary with weather and daylight, so grids also need flexibility from combinations of storage, transmission, other generation and demand management. Storage shifts electricity in time; it does not create an independent source of energy. Nikola Tesla's work on alternating current is part of the longer history of the electrical systems behind that socket.
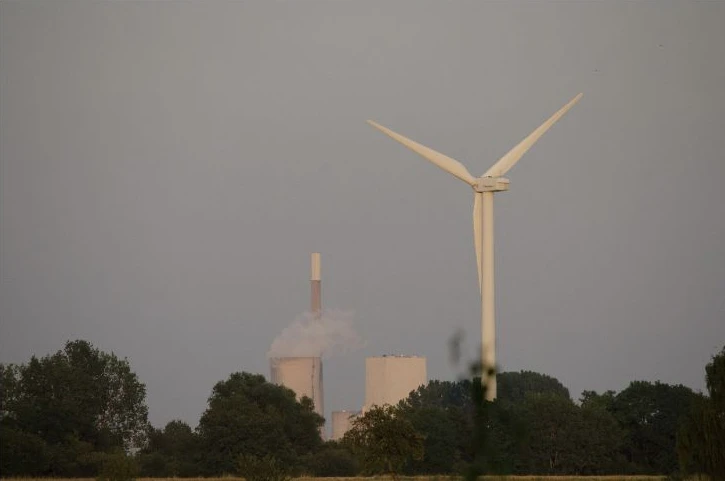
Image unavailable.
A wind turbine stands in front of a coal-fired power station beyond trees.

When can the initial emissions be offset?#
Imagine adding each car's emissions to a running total. The electric car may start higher because of its battery. If it then causes fewer greenhouse gases per mile than the petrol car, the gap narrows with distance. The point where the totals meet is often called the emissions break-even point. Beyond it, the modelled electric total is lower. This is a comparison of accumulated climate emissions, not a claim that past emissions have been physically removed from the atmosphere.
The calculation has two moving parts: the initial difference in manufacturing emissions and the difference in emissions per mile during use. A smaller manufacturing gap or a larger per-mile advantage brings the crossing closer. A larger battery footprint, a dirtier charging supply or a very efficient petrol comparator can move it farther away. If the assumed electric car does not have a per-mile advantage, there may be no crossing in that scenario. If the car is retired before reaching the crossing, that model does not show a lifetime saving.
Distance matters twice. Total lifetime distance determines how often the operational saving accumulates; annual mileage determines how many years it takes to reach any particular distance. Replacing a battery would add a manufacturing burden, while using the original for longer spreads its initial footprint across more miles. A single headline such as “breaks even after so many miles” is incomplete without the vehicles, battery, grid and driving assumptions that produced it.
What do actual comparisons show?#
The IEA's 2024 analysis found that a medium-size battery electric car had about half the lifecycle greenhouse-gas emissions of an equivalent combustion-engine car on a global average. The estimated advantage differed by place: around 20% in India, and more than 60% in the United Kingdom and Chile. These are results of the agency's comparison, not the emissions of every car in those countries. Electricity supply and other assumptions help explain the range; it would be misleading to apply the global average to a particular vehicle without examining its inputs.
In a July 2025 study, the International Council on Clean Transportation (ICCT) compared sales-weighted medium-segment cars sold in the European Union in 2025. It included vehicle and battery production and recycling, fuel and electricity production, use and maintenance. Using a projected average EU electricity mix for 2025–2044, it estimated 63 grams of CO2 equivalent per kilometre for the battery electric car and 235 for the gasoline car using the average gasoline–ethanol blend: 73% lower lifecycle emissions for the electric car. Production emissions were about 40% higher for the electric car, and the study estimated that its lower use-phase emissions offset that extra burden after about 17,000 kilometres. That crossing is specific to this model and its projected grid, not a universal threshold. The study stresses that lifetime, real-world consumption and changes in the electricity mix materially affect the result.
A separate U.S. example published by the Environmental Protection Agency uses Argonne National Laboratory's GREET 2 2021 estimates for model-year 2020 vehicles. It assumes a battery electric car with a 300-mile electric range, a petrol car rated at 30.7 miles per gallon, 173,151 miles of life for each and U.S. average grid emissions. In that illustrative model, the electric car has higher manufacturing and end-of-life emissions but lower total emissions when driving and energy supply are included. The battery is shown separately; the petrol car has both upstream fuel and tailpipe emissions.
The U.S. example is not a prediction for a new car bought today, nor do the IEA global and ICCT European comparisons independently reproduce it. They use different scope and assumptions. Their shared lesson is the shape of the accounting: an upfront battery burden can be outweighed by lower emissions during use. The exact size of that advantage belongs to the specified comparison.
Electric drivetrains also use energy efficiently. EPA reports that electric vehicles use about 87–91% of energy from the battery and regenerative braking to propel the vehicle, compared with about 16–25% of gasoline energy converted to movement for gasoline vehicles in its cited combined-driving figures. These are different points in the energy chain: battery energy is not the same as energy at a power plant, and gasoline in the tank is not the same as crude oil in the ground. They help explain efficient operation but cannot replace a full lifecycle calculation.
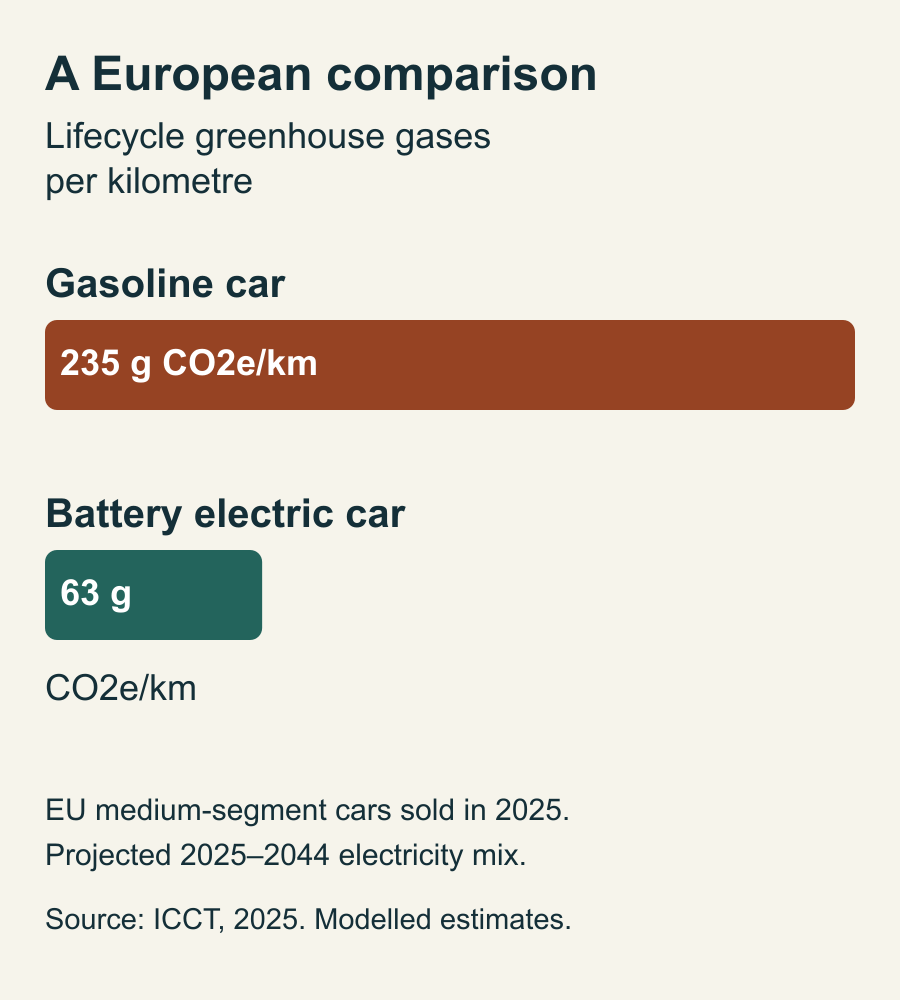
Image unavailable.
Bar chart: gasoline car 235 grams CO2 equivalent per kilometre; battery electric car 63 grams.
Is climate the whole environmental story?#
Greenhouse gases affect climate wherever they are emitted. Air pollution also has a local dimension: where a pollutant is released, who breathes it and what type of pollutant it is all matter. EPA notes that combustion vehicles emit smog-forming pollutants including nitrogen oxides and particulate matter from their exhaust. A battery electric car has no tailpipe exhaust on the street. Electricity generation and industrial production can still pollute where they occur, depending on the facilities and controls involved.
Nor do electric cars remove the physical impacts of roads and vehicles. Tyres and road surfaces wear, and brakes can produce particles. Regenerative braking can reduce use of friction brakes, but the net non-exhaust pollution depends on the vehicle and its use. A greenhouse-gas total alone cannot answer how much air pollution occurs in a particular neighbourhood, or how extraction affects water, land, workers and nearby communities.
Battery materials are another part of that wider picture. Mining and refining can put pressure on local environments and communities, and the impacts differ by material and location. Recycling can recover materials and reduce demand for newly mined inputs, but it requires collection, transport, safe processing and markets for recovered material. It is not a closed loop merely because a battery is theoretically recyclable.
The IEA's 2024 report projects that, if recycling is effectively scaled, recovered materials could reduce demand for newly supplied lithium and nickel by 25% and cobalt by 40% in 2050 under a scenario meeting national climate targets. That is a conditional future scenario, not a present recycling rate. The report points to manufacturing scrap as an important near-term feedstock and more end-of-life EV batteries later. What happens to a battery after use matters, but it does not erase the impacts already incurred in making and using it.
The clearest answer therefore depends on the question. A battery electric car eliminates its own tailpipe exhaust. A lifecycle comparison typically finds a climate advantage over a comparable petrol car, including the battery, but the size of the advantage depends on the cars, the electricity system and the distance travelled. Neither finding turns a car into an impact-free object. As with plastic that reaches the deep ocean, a material's story continues well beyond the moment it leaves a user's hands.

Image unavailable.
Satellite image of clusters of pale rectangular evaporation ponds in Chile’s Salar de Atacama.
Keep exploring
Sources & further reading
Follow the original research, records, and explanations behind this story.
- EV Battery Supply Chain Sustainability International Energy Agency
2024 medium-car comparison, battery production and recycling scenario
- New IEA online tool compares lifecycle emissions from traditional and electric cars International Energy Agency
Lifecycle boundaries and adjustable variables
- Electric Vehicle Myths US Environmental Protection Agency
U.S. GREET example, energy efficiency and electricity
- Global Electricity Review 2026 Ember
2025 world electricity generation shares
- Life-cycle greenhouse gas emissions from passenger cars in the European Union: A 2025 update and key factors to consider International Council on Clean Transportation
2025 EU medium-segment model and assumptions
- Smog Vehicle Emissions US Environmental Protection Agency
Tailpipe and smog-forming pollutants
- Non-exhaust Particulate Emissions from Road Transport OECD
Tyre, road and brake particulate emissions
- Where Batteries Begin NASA Earth Observatory
Salar de Atacama brine ponds, image credit and water concerns
- Nuclear power and the environment U.S. Energy Information Administration
Operating emissions, fuel-cycle emissions, safety and radioactive waste
See the story in motion
Watch our illustrated video, then explore another question below.
Watch on YouTubeFollow the thread